
14/08/2017
WebSphere 8.5 HTTPS handshake
Here is a new post for the usual “do not use humongous enterprise blobs” thread, this time the main character is IBM WebSphere Application Server 8.5.
Recently one of our developers deployed a new application which require some http requests to an external web service via https protocol, what’s the problem? Get the CA certificate, import into the WebSphere cell trust store and synchronize nodes, right?
Well, in this case we got this nasty exception each time the WebSphere JVM tried to start the https handshake:
java.lang.ArrayIndexOutOfBoundsException: Array index out of range: 64
Googling around I found the problem, the webserver which hosts the web service uses TLS protocol (which is good for security) with Diffie-Hellman group key size of 2048bit (which is definitively good for security), by default WebSphere Application Server 8.5 uses SSLv3 (bad) and TLS1.0 protocols when it acts as https client (SSL_TLS configuration), and gives this exception when it handshakes https using TLS1.0 with a server which uses a 2048bit DH key.
As always we were in a hurry (meh… :\) and this issue blocks the developers, since we were working on a develpment environment I suggested to create a new virtualhost which will host the webservice with a smaller DH key, just as workaround while we found a solution.
The sysadmin on the webservice side agreed so he created this new virtualhost with a new https certificate and configuration (none of those services were available from the web).
Everything set so we changed the webservice url on our application, but we got the same exception… so I found that our WebSphere Instance can’t handshake virtualhosts because it still uses IBM JVM 1.6 which do not support server name identification (SNI).
Fantastic, welcome back to the year 2006 :\
So I tried another solution, force WebSphere to handshake with TLS1.2 protocol, that will work with 2048bit DH but we have to test any other application deployed on the WebSphere instance and make sure that every https handshake work as expected.
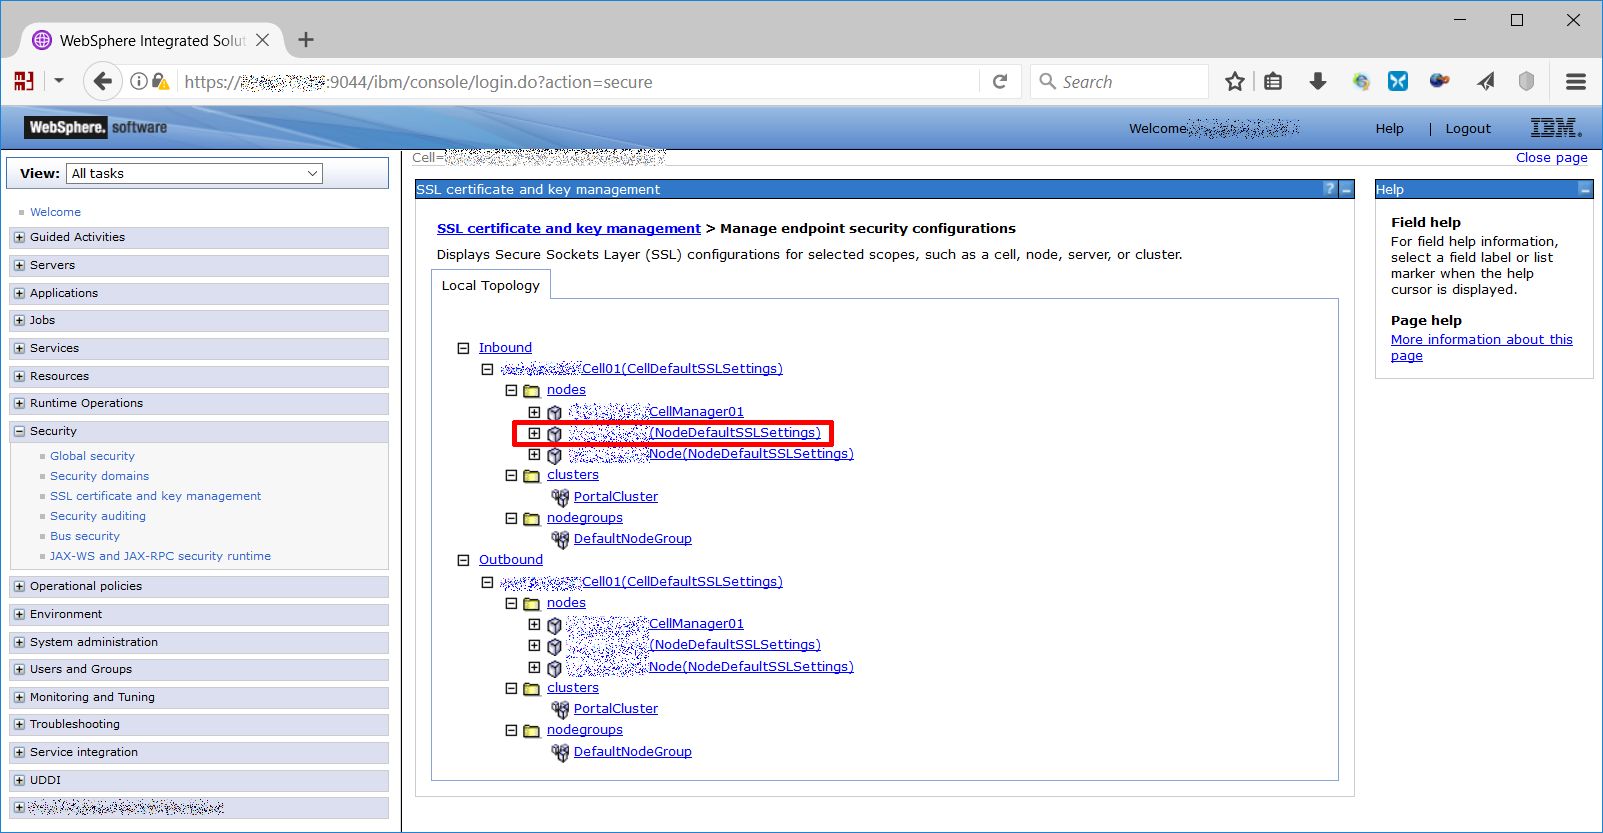
Log on the WAS console on the deployment manager (if your architecture is a cluster) and go to Security -> SSL certificate and key management -> Manage endpoint security configurations, from the local topology choose a Node from the inbound tree.
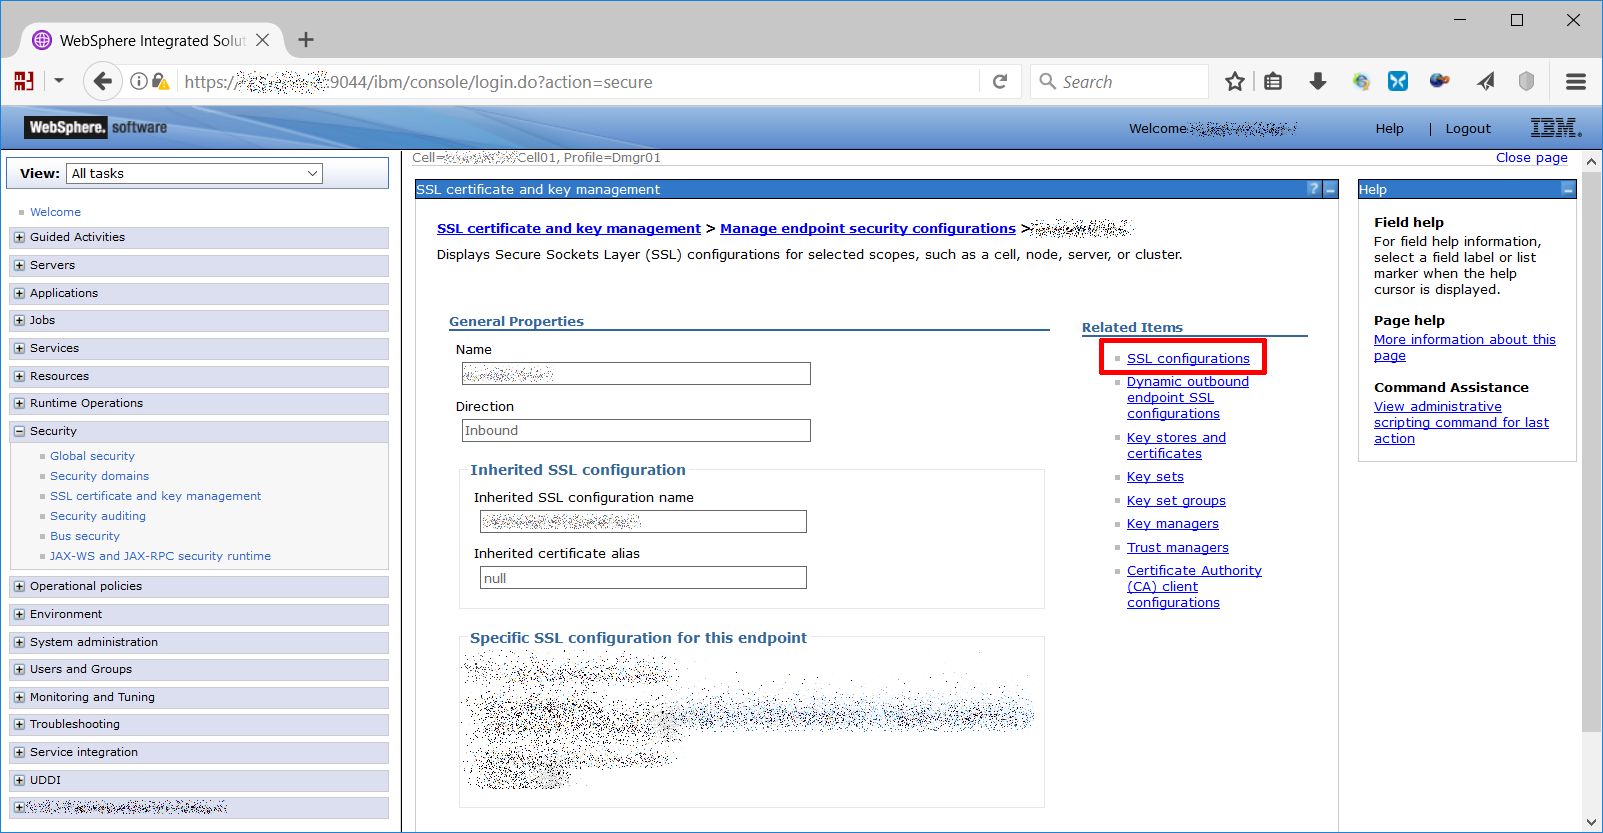
Then choose “SSL configurations”
Choose CellDefaultSSLSettings and “Quality of protection (QoP) settings”…
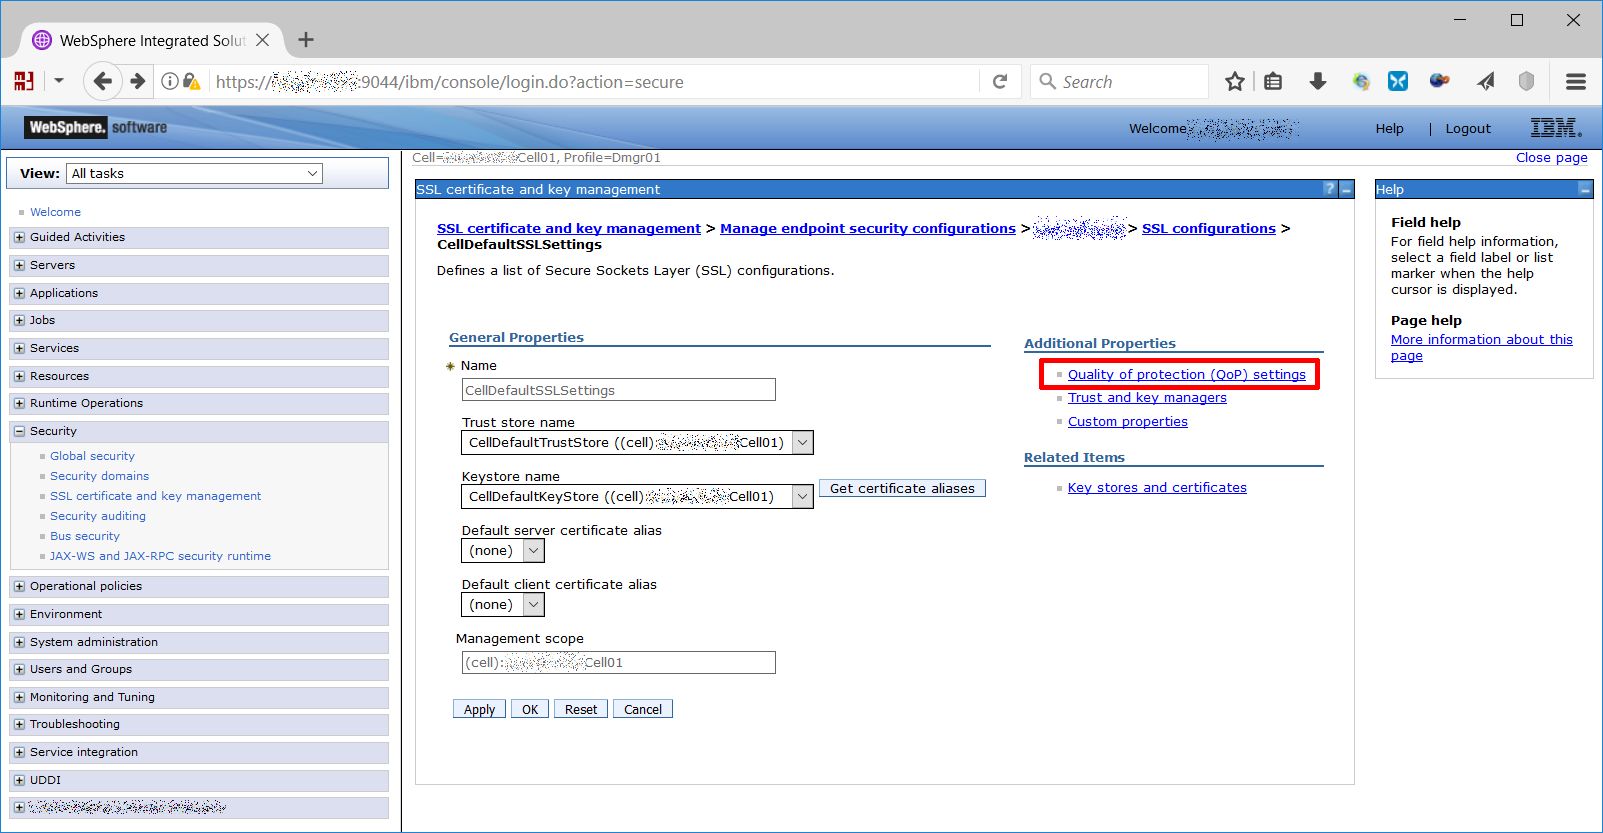
…and from protocol dropdown choose TLSv1.2 option, after that apply, save configuration and repeat from the previous point selecting NodeDefaultSSLSettings instead of CellDefaultSSLSettings.

Now you must edit two ssl.client.props files, one inside Deployment Manager root and one inside AppServer root, in my case those files were in:
- <WebSphere ROOT>/AppServer/profiles/Dmgr01/properties/ssl.client.props
- <WebSphere ROOT>/wp_profile/properties/ssl.client.props
Inside the files you must find “com.ibm.ssl.protocol” variable and change its value from SSL_TLS to TLSv1.2 on all your WebSphere server and restart all services (Deployment Manager, Node Agent and WebSphere instances).
After the reboot all seems to work, finally our web application completed the https handshake using TLS 1.2 and the 2048bit DH key, problem solved? No :(
After the restart we noticed some bad issues during the Node Agent synchronization, checking its SystemOut.log I found this nasty exception:
WebSphere javax.net.ssl.SSLHandshakeException: Client requested protocol TLSv1 not enabled or not supported
The synchronization process between Node Agent and Deployment Manager uses https protocol and during the handshake the Node Agent act as client and use TLS 1.0 protocol while the previous configuration forces TLS 1.2 protocol.
To solve this problem I found that one of the other options (SSL_TLSv2) extend the default option (SSL_TLS) adding TLS 1.1 and TLS1.2 protocols, that seems perfect so I repeated all the previous steps (protocol selection for incoming CellDefaultSSLSettings and NodeDefaultSSLSettings and ssl.client.props for Deployment Manager and Appserver instance) using SSL_TLSv2 value instead of TLSv1.2.
After a full restart finally everything seems to work.