 It’s been a while since a wrote something about Eve, and to be honest this is not a State Of The Alliance (SOTA) because… well I’m not an alliance executor and not even a corp CEO, I’m just a regular grunt, as my Twitter bio says I’m just another kender exploring New Eden.
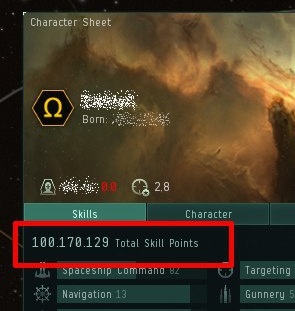
This is not only a post about Eve, in some sense this is a milestone for me because my main character reached the symbolic objective of 100.000.000 skill points; If I sum all the skill points of all my toons I’m reaching about 400.000.000 SP, but you know… the first char is always the most beloved.
Last time I wrote something about Eve I was starting to train one of my biggest and most precious objective, the JF pilot, It was exactly 4 years ago, I reached that goal and despite all the other big objectives (dread and carrier pilots well trainer, two maxed rorqual toons, one almost maxed industrial an reprocessing toon, 6 maxed pi toons, etc etc…) that JF was one of the sweetest and maybe the most precious.
The Italian Alliance I started with died almost 6 months after I joined because of too many elite-pvp players inside, with the core group we joined CO2 back in Tribute, I was part of one of the epic siege of M-OEE8, we fought hard, we lost the first real fought Keepstar citadel and became history.
Then with the entire alliance I moved to Catch and Impass, where we suffered the biggest betrayal in the history of Eve aka “the Judgement Day”.
Thanks to some good friends (and awesome human beings) we moved to Test Alliance Please Ignore in Esoteria, one of the most remote regions of the Eve universe.
We spent almost a year in Test and I have to admit that I loved it, my time in CO2 was great, but the alliance really changed during the years, it became more obsessed on pvp and revenge, almost closed to new players, at some point CO2 became the only alliance without allies and against everyone, and honestly I didn’t like it…
Test was really different, even today I think it’s the most organized alliance I ever seen, awesome wiki, doctrines extremely well documented, very friendly for noobs, everything was great for regular grunts like me, can’t say the same thing for our CEO because Test leadeship seems quite… how can I say… tricky.
After that experience our corp moved into another historic alliance, The Initiative. I always heard about them as smaller but more pvp focused alliance, some kind of elite pvp group inside the Imperium coalition.
At first I was not sure at all and was tempted to leave my corp and stay in Test, but I decided to have faith in our former CEO (I repeat an awsome person) so I jumped into Init.
We started living between Querious (which was the first null region when I started playing Eve) and Fountain, It was tough at first because we lost our habits (we made a lot of huge industrial production in Esoteria) but then I found an equilibrium and things started to work pretty well.
After about six months into the trial alliance Initiative Mercenaries we were promoted as full members of The Initiative, and I have to admit that I was really proud of it, we were parte of one of the most skilled and active groups in the history of Eve.
With Init we made history again, we archived something that everyone in the game considered impossibile, something called the “siege of Rage” which took an entire year of work and preparation and concluded with the destruction of the first Keepstar citadel ever built in the game, we made history, again.
Living in Init is quite different from every other alliance I lived before, in Init I found great fleet commanders, awesome people always helpful and willing to do everything, but it’s a more mature alliance, you must be able to get your stuff, you must be more independent from a logistic point of view, don’t expect the alliance will run for you providing everything you need, you asked to be part of Init, not the opposite.
Now I continue to play, yesterday I lost my first capital into a huge brawl (I used them several times during the years but never lost one) that made almost 1 trillion isk in lost ships, It was awsome.
During the last year I had moments when I really never played, when I thought to leave the game, months spent mainly doing PI, putting skills in the queues and nothing else; it was not an alliance fault, nor my corp fault, it was simply the consequence of huge CCP mistakes, but that’s a different story for a new SOTA rant.
o7


 As you may heard on march 10th
  It’s been a while since a wrote something about Eve, and to be honest this is not a State Of The Alliance (SOTA) because… well I’m not an alliance executor and not even a corp CEO, I’m just a regular grunt, as my Twitter bio says I’m just another kender exploring New Eden.



![[ Celebrate 30 years of GNU! ]](https://tasslehoff.burrfoot.it/wp-content/uploads/2013/11/GNU_30th_badge.png)

