17/10/2018

Wind Infostrada FTTC

Dopo tanto tempo ho deciso di scrivere uno post in italiano sperando che possa agevolarne la diffusione tra gli utenti del nostro Paese che si accingono ad aderire alle varie offerte di connettività propinate dai diversi operatori tlc.

Nel mio caso si tratta di Wind, operatore con il quale ho iniziato ad avere rapporti nel 2007 dopo una iniziale esperienza con NGI.
A onor del vero devo confessare di non aver mai avuto problemi catastrofici, la mia vecchia linea ADSL (seppur limitata a 4Mbps in downstream) si è sempre dimostrata stabile, affidabile e con una latenza decisamente superiore alla media.
A parte il feedback tecnico (variabile da zona a zona a causa dell’infrastruttura spesso in stato di abbandono) quello che mi ha favorevolmente impressionato è la flessibilità di Wind nell’applicare profili di connettività differenti da quelli proposti come standard, nel mio caso alzando la banda di upstream da 128Kbps a 512Kbps.

Poco meno di un anno fa scopro di avere copertura FTTC, viste la tariffe vantaggiose e il buon rapporto maturato decido di rimanere con questo operatore, tutto perfetto fino allo scorso agosto, quando noto un sensibile rallentamento nel downstream e un drastico aumento nella latenza.
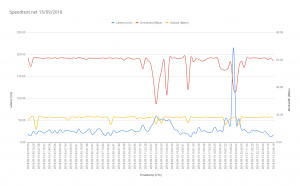
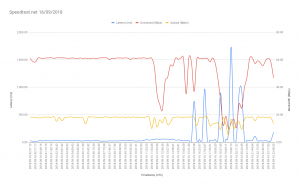
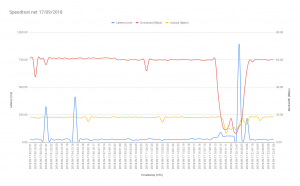
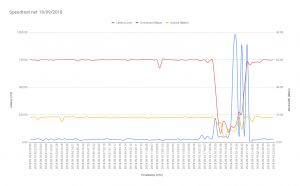
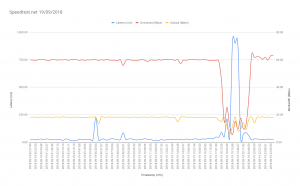
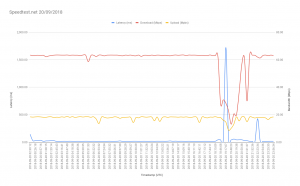
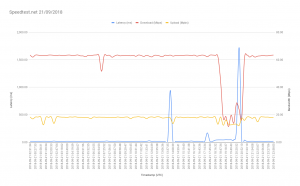
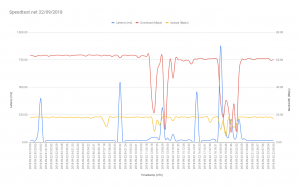
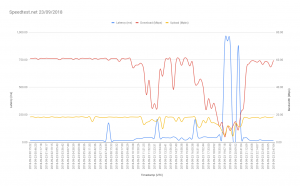
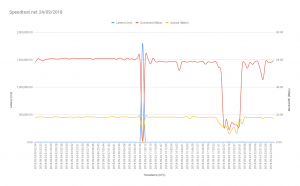
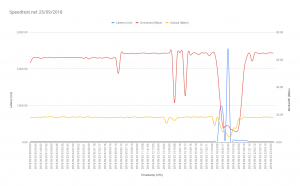
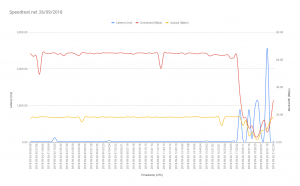
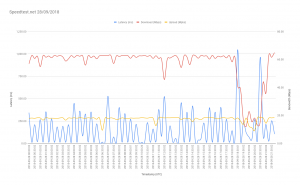
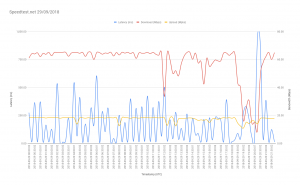
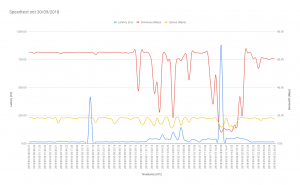
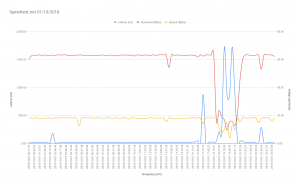
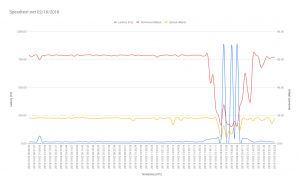
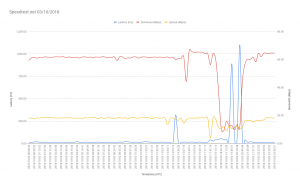
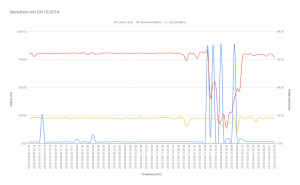
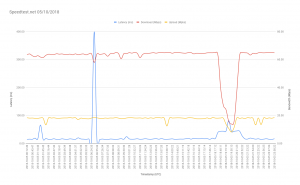
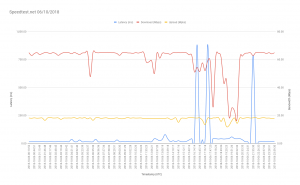
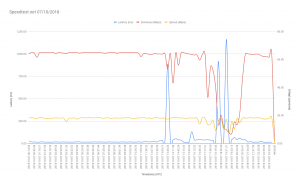
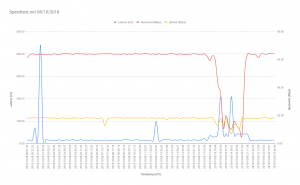
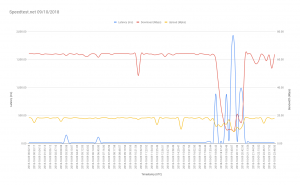
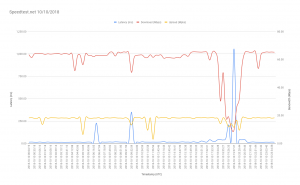
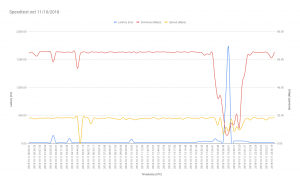
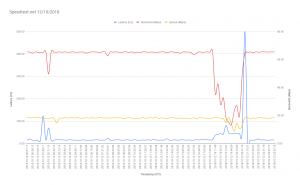
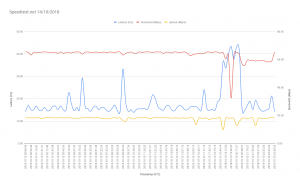
Provo a lanciare qualche test con Speedtest.net utilizzando il server per me più affidabile (Fastweb Milano) e ottengo un ping aumentato da 5/6 a 25 ms e una banda in downstream diminuita da 60/70Mbps a 15/20Mbps.

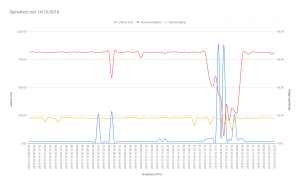
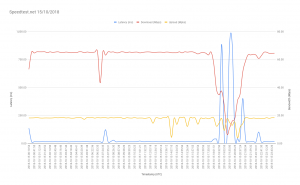
Ripeto il test ogni giorno e ottengo lo stesso risultato, schedulo un test ogni 15 minuti utilizzando l’ottimo speedtest-cli da cui emerge un evidente problema di saturazione nelle ore serali, con qualche anticipo pomeridiano nel week end,  questo è il risultato, giudicate voi.


13/08/2018

Quick check multipath status

Recently I had a huge activity in a customer’s datacenter, moving rack cabinets around for some works on the power supply lines. I love working on the hardware or inside datacenters, some people consider it a low profile work but I always found it very inspiring and it gives me so much satisfaction, sadly it happens rarely :( BTW, I managed to complete this tasks without shutting down anything and without any downtime thanks to power redundancy on almost any device (server, blade chassis, network or storage switch/device), a couple of 32A extension wires and a very precise action plan. Winner winner chicken dinner! One critical aspect was the storage, we had a lot of systems which extensively use SAN over FC interfaces, and some of the SAN FC switches had only one PSU, any storage path had redundancy but cutting down half of your storage devices on production systems require to be very careful and test everything. If you have a lot of servers with different environments (GNU/Linux, Windows Server and Vmware ESX) and you need to cut off and restore paths multiple times, you need to be very precise in checking paths status to avoid storage losses and potential data corruptions. Here is some quick hints to check your multipath devices on those environments, thanks to command line interface you’ll be able to check many systems with very few commands, save a lot of time and avoid a lot of headheaches.

GNU/Linux

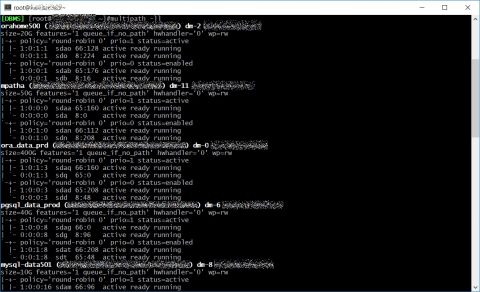
On GNU/Linux checking multipath status is very easy, you’ll only need to run “multipath -ll” and you’ll get the status of each path for every multipath device on your server. Regarding HBA all you need to know is under /sys/class/fc_host directory where you’ll find one host* directory for each device, inside those directories you’ll find port_name and node_name with WWPN and WWN. With basic bash skills and ssh you can easily grab those information on each server, this is a trivial example.

Windows

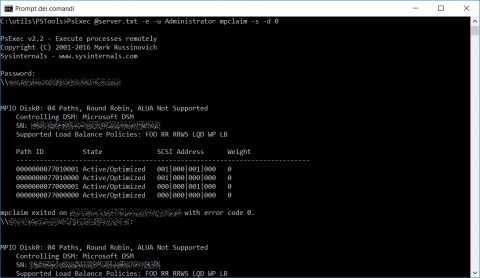
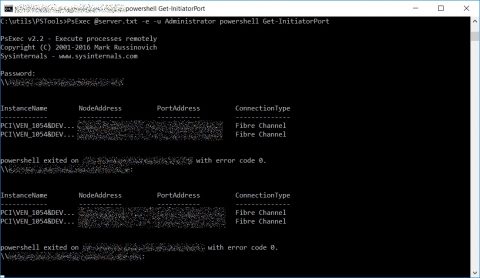
The only requirement is the fantastic and free PsExec utility from Mark Russinovich Edit a text file with a list of all your server’s ip or hostnames, one per line (server.txt). PsExec @server.txt -e -u <USERNAME> mpclaim -s -d <DEVICE ID> If you want to see all the details (for example node number and port number) of your HBA launch Get-InitiatorPort command on a Powershell instance with superuser grants. PsExec @server.txt -e -u <USERNAME> powershell Get-InitiatorPort

Vmware ESXi

First of all you must enable ssh daemon on each Vmware host (follow this Vmware KB article), if you want to login with ssh keys follow this KB article. For checking multipath status you must run this command “esxcli storage nmp device list”, the output is quite verbose so it’s better to grab only the information we need adding a nice “| grep Working”, each line shows the paths for every datastore on the Vmware server. You can find WWN and WWPN with “esxcli storage core adapter list” As for GNU/Linux server you can easily cycle through your Vmware servers using ssh and bash to grab those information with a single script.

29/05/2018

http request and tcpdump

If you work with http reverse proxy one of the most frequent problem is that people working on the backend systems complain about things they expect but they don’t see coming from your frontend service.
Working with Tivoli Access Manager this happen to me every time I pass some value to the backend services like iv-user, iv-remote-address or LtpaToken… every time people open the browser, press F12 and expect to find those data into the http request exchanged with the browser… NO!!! It does not work like that! :\

In these moments the only way to close the case is sniff some packets and put them in front of their nose with a giant red arrow showing the damn data they are expecting and which is perfectly exchanged between TAM and backend servers.
You can do this in many ways, the fastest and simple imho is by one of the most important tool for problem solving and analysis, the swiss knife of every sysadmin: tcpdump.

In this case the syntax of tcpdump is a bit “esoteric”, here it is:

sudo tcpdump -nn -i <interface> -A -s 0 '<protocol> port <port> and (((ip[2:2] - ((ip[0]&0xf)<<2)) - ((tcp[12]&0xf0)>>2)) != 0)'

For example: sudo tcpdump -nn -i eth0 -A -s 0 ‘tcp port 80 and (((ip[2:2] – ((ip[0]&0xf)<<2)) – ((tcp[12]&0xf0)>>2)) != 0)’

If you want to grab the dump and open with some other software (for example the great Wireshark) you must add “-w /path/to/dump/dump.dmp”

That’s all.

14/08/2017

WebSphere 8.5 HTTPS handshake

Here is a new post for the usual “do not use humongous enterprise blobs” thread, this time the main character is IBM WebSphere Application Server 8.5.

Recently one of our developers deployed a new application which require some http requests to an external web service via https protocol, what’s the problem? Get the CA certificate, import into the WebSphere cell trust store and synchronize nodes, right?
Well, in this case we got this nasty exception each time the WebSphere JVM tried to start the https handshake:

java.lang.ArrayIndexOutOfBoundsException: Array index out of range: 64

Googling around I found the problem, the webserver which hosts the web service uses TLS protocol (which is good for security) with Diffie-Hellman group key size of 2048bit (which is definitively good for security), by default WebSphere Application Server 8.5 uses SSLv3 (bad) and TLS1.0 protocols when it acts as https client (SSL_TLS configuration), and gives this exception when it handshakes https using TLS1.0 with a server which uses a 2048bit DH key.

As always we were in a hurry (meh… :\) and this issue blocks the developers, since we were working on a develpment environment I suggested to create a new virtualhost which will host the webservice with a smaller DH key, just as workaround while we found a solution.
The sysadmin on the webservice side agreed so he created this new virtualhost with a new https certificate and configuration (none of those services were available from the web).
Everything set so we changed the webservice url on our application, but we got the same exception… so I found that our WebSphere Instance can’t handshake virtualhosts because it still uses IBM JVM 1.6 which do not support server name identification (SNI).
Fantastic, welcome back to the year 2006 :\

So I tried another solution, force WebSphere to handshake with TLS1.2 protocol, that will work with 2048bit DH but we have to test any other application deployed on the WebSphere instance and make sure that every https handshake work as expected.

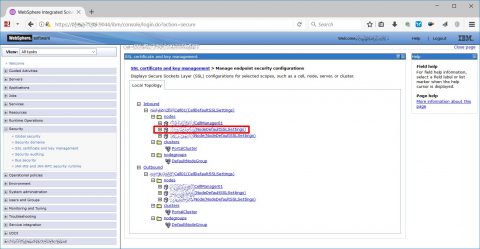
Log on the WAS console on the deployment manager (if your architecture is a cluster) and go to Security -> SSL certificate and key management -> Manage endpoint security configurations, from the local topology choose a Node from the inbound tree.

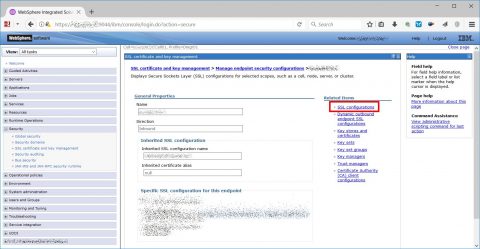
Then choose “SSL configurations”

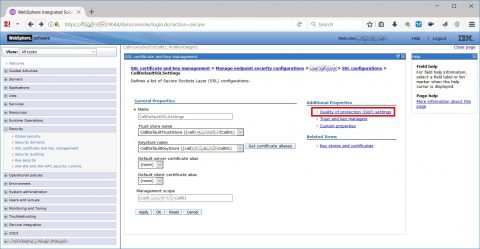
Choose CellDefaultSSLSettings and “Quality of protection (QoP) settings”…

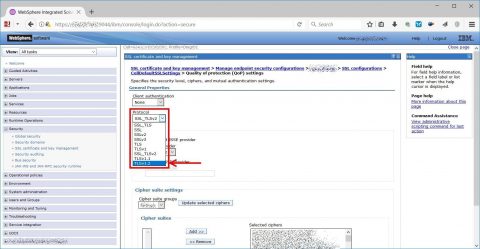
…and from protocol dropdown choose TLSv1.2 option, after that apply, save configuration and repeat from the previous point selecting NodeDefaultSSLSettings instead of CellDefaultSSLSettings.

Now you must edit two ssl.client.props files, one inside Deployment Manager root and one inside AppServer root, in my case those files were in:

  • <WebSphere ROOT>/AppServer/profiles/Dmgr01/properties/ssl.client.props
  • <WebSphere ROOT>/wp_profile/properties/ssl.client.props

Inside the files you must find “com.ibm.ssl.protocol” variable and change its value from SSL_TLS to TLSv1.2 on all your WebSphere server and restart all services (Deployment Manager, Node Agent and WebSphere instances).

After the reboot all seems to work, finally our web application completed the https handshake using TLS 1.2 and the 2048bit DH key, problem solved? No :(

After the restart we noticed some bad issues during the Node Agent synchronization, checking its SystemOut.log I found this nasty exception:

WebSphere javax.net.ssl.SSLHandshakeException: Client requested protocol TLSv1 not enabled or not supported

The synchronization process between Node Agent and Deployment Manager uses https protocol and during the handshake the Node Agent act as client and use TLS 1.0 protocol while the previous configuration forces TLS 1.2 protocol.
To solve this problem I found that one of the other options (SSL_TLSv2) extend the default option (SSL_TLS) adding TLS 1.1 and TLS1.2 protocols, that seems perfect so I repeated all the previous steps (protocol selection for incoming CellDefaultSSLSettings and NodeDefaultSSLSettings and ssl.client.props for Deployment Manager and Appserver instance) using SSL_TLSv2 value instead of TLSv1.2.

After a full restart finally everything seems to work.

13/03/2017

Goaccess

One of the best software I start using this year is goaccess, it’s AWSOME!

Basically goaccess is a web log analyzer, like awstats or webalizer, like them It’s simple, it’s quick, it’s very useful, but unlike them it produces very very beautiful reports.

Just be careful, goaccess it’s not like Google Analytics or Piwik, it doesn’t track uses via javascript and does not analyze visitors but only access logs.
That’s another reason why I love it, if you need to quickly analyze your logs to find a problem or to find the reason of a particular load spike goaccess is your tool.

Another great feature if this tool is that you can simply pipe stdout to feed goaccess, for example you can parse your logs with sed, awk and grep and get a quick analysis.

Goaccess install is really simple, it’s included in the most used repositories for the major GNU/Linux distros, but I strongly suggest to clone it from the official git repository and follow the simple compile syntax, just remember some requirements:

  • GeoIP and GeoIP-devel
  • autoconf and automake
  • tokyocabinet and tokyocabinet-devel (for incremental analysis)

Last but not least goaccess has a very good support from its maintainer and the community, if you have a question, a problem or a request open an issue and you’ll have a quick answer from kind and collaborative people.
Recently I had a problem with some strange logs, I asked for a solution, I discussed directly with the project maintainer and he agreed to add a new feature to fix this kind of logs; if I had this problem with some sort of super-enterprise commercial software from IBM, Oracle or any other big company I will surely had to open tickets over tickets (with an active support subscription), write mails over mails, get some huge conference calls with people all over the world and *perhaps* have a workaround and the promise of a patch in the next major version of the product… :\

Here is a simple cheatsheet of goaccess syntaxes I use the most of times.

A simple analysis from command line (change COMBINED with COMMON if you want to analyze logs with common format):

goaccess --log-format=COMBINED -f /var/log/httpd/access_log*

Html output (very very beautiful for presentations or visual reports)

goaccess --log-format=COMBINED -f /var/log/httpd/access_log* -o /tmp/report.html

Parse logs from several directories

cat /var/log/httpd/access_log /var/log/apache2/request.log | goaccess --log-format=COMBINED

Exclude a pattern from the analysis

grep -v "GET \/exclude_this_path\/" /var/log/httpd/access_log | goaccess --log-format=COMBINED

Exclude several patterns from the analysis

grep -vE "GET \/exclude_this_path\/|file_to_exclude.html|gif_to_exclude.gif" /var/log/httpd/access_log | goaccess --log-format=COMBINED

Analyze only logs between two specific hours (for example 8:00AM to 9:10AM)

sed -n '/01/Mar\/2017:08:00/,/01\/Mar\/2017:09:10/ p' access_log | goaccess --log-format=COMBINED

Analyze COMMON logs with X-Forwarded-For ip format (xxx.xxx.xxx.xxx, yyy.yyy.yyy.yyy, zzz.zzz.zzz.zzz)

goaccess --log-format='%h,| %^ %e [%d:%t %^] "%r" %s %b %^' --date-format='%d/%b/%Y' --time-format='%T' -f /var/log/httpd/access_log

Analyze COMBINED logs with X-Forwarded-For ip format (xxx.xxx.xxx.xxx, yyy.yyy.yyy.yyy, zzz.zzz.zzz.zzz)

goaccess --log-format='~h{," } %^ %e [%d:%t %^] "%r" %s %b %^' --date-format='%d/%b/%Y' --time-format='%T' -f /var/log/httpd/access_log

Keep your goaccess database open for incremental analysis (database files in /tmp)…

goaccess --log-format=COMBINED -f /var/log/httpd/access_log --keep-db-files

…and add new logs to the analysis and keep the database open (database files in /usr/local/temp)

goaccess --log-format=COMBINED -f /var/log/httpd/access_log --load-from-disk --keep-db-files --db-path=/usr/local/temp

Give it a try and I’m sure you’ll love it!

« Post precedenti | Post successivi »